

What if the lowest-cost panel delivers the weakest long-term return on your factory roof? For a 500 kW+ project, a commercial solar roi calculator pakistan must account for more than installation cost. Industrial tariffs, on-site consumption, export credits, and the 2026 shift to net billing all affect payback. The cheapest system can look attractive upfront and still underperform over its operating life.
Rising electricity costs are a central concern for industrial decision-makers, and the new billing structure makes self-consumption more financially important than exporting surplus power. The challenge is to turn those variables into a defensible investment case rather than relying on a headline payback estimate.
This guide explains how to calculate payback and Levelized Cost of Energy (LCOE), model net billing, and assess yield over 25 years. It also shows how to compare HJT’s heat performance and degradation with TOPCon’s cost advantage, then evaluate whether storage could improve self-consumption. The result is a clearer basis for board approval and a system design aligned with your site’s load profile.
Key Takeaways
- Use 12 months of electricity bills to map load patterns and establish a realistic baseline before sizing an industrial solar system.
- Build a commercial solar roi calculator pakistan around project-specific generation estimates, capital and operating costs, and the applicable B3 or B4 tariff structure.
- Compare HJT and TOPCon using site conditions, expected energy yield, and degradation assumptions. Higher panel efficiency alone doesn’t determine the strongest financial return.
- Assess rooftop or carport conditions before assigning value to bifacial generation, and use city-specific P50/P90 modelling to test expected output against uncertainty.
- Include EPC, maintenance, monitoring, and energy management in the model to account for performance over the system’s operating life.
The 2026 Commercial Solar Landscape in Pakistan
For industrial buyers, solar economics depend on when electricity is consumed, not just how much a system generates. Pakistan’s 2026 shift from net metering to net billing changes the value of surplus power: new prosumers generally receive a lower rate for exports than they pay to import grid electricity. The solar power landscape in Pakistan provides broader context, but an investment model must reflect the applicable rules and tariff structure for the specific site.
Under the 2026 net billing framework described here, exported electricity is compensated at an estimated PKR 8–11 per unit, while industrial grid tariffs are reported to vary around PKR 44–60 per kWh, with some peak periods higher. Treat these as planning references, not a substitute for a current bill or applicable DISCO schedule. A commercial solar roi calculator pakistan should separate self-consumed generation from exports, then value each according to the facility’s B3 or B4 billing structure.
Industrial Tariffs and Peak/Off-Peak Dynamics
Peak and off-peak rates affect the value of each solar kilowatt-hour. Solar that coincides with high-cost daytime operations can displace more expensive grid energy first. Generation beyond on-site demand may earn only the lower export credit. Model the site’s interval load against its tariff periods rather than applying one blended rate to all solar output. Also review fixed and demand-related charges. These may remain payable even when solar reduces imported units, so count them as avoidable savings only if the bill’s tariff rules support that treatment.
Regulatory Shifts: NEPRA and the Net Billing Era
Net billing separates the price of imported electricity from compensation for exported electricity. That makes self-consumption the primary ROI driver for many new projects. Storage can help shift solar energy to later site demand, but its value depends on load timing and system economics. Existing agreements may have different terms, so confirm the site’s status and applicable contract before modelling.
For LESCO, K-Electric, and IESCO projects, don’t assume that one export rate or import adjustment applies uniformly. Use the latest available DISCO terms and model conservative, base, and favourable export scenarios. This sensitivity analysis shows how much the investment depends on grid sales. It also helps frame energy security as a risk-management benefit: on-site generation can reduce exposure to tariff volatility, while resilience during outages requires suitable storage and system configuration.
Cost per watt is only an equipment or capacity comparison. It doesn’t capture annual yield, load matching, degradation, export value, fixed charges, or operating performance. A defensible baseline compares lifecycle energy value with total project costs, not just the lowest quoted rate per watt.
Key Variables in a Commercial Solar ROI Calculation
A reliable model includes the full cost of ownership, not only the panel and inverter quote. Capital expenditure (CAPEX) should capture equipment, project development and EPC, installation, and any applicable interconnection or permitting costs. Operating expenditure (OPEX) should account for cleaning, monitoring, insurance, and planned maintenance. Confirm which items apply to the site and how they’re priced before comparing proposals.
Model net billing explicitly. Solar energy consumed on-site offsets an import, while exported energy earns a separate credit. Applying the retail tariff to every generated unit can overstate savings. The analysis of net-metering policies offers context on how changing buyback rates affect solar economics. For a project forecast, use the export terms that apply to the facility, then test alternative assumptions.
Hardware Selection as a Financial Lever
Panel technology influences lifetime yield, but the result depends on site conditions and verified specifications. HJT panels have a superior temperature coefficient for Pakistan’s climate, which can help limit heat-related yield losses. Compare the manufacturer’s data under the project’s expected operating conditions, including temperatures above 45°C where relevant. Include annual degradation in the forecast rather than assuming first-year output continues unchanged.
Inverter performance can also affect project economics. Nippon Energy offers Nippon Smart AI Inverters, but model any expected operational or export benefit only when the specific functions are confirmed for the proposed system. For lithium-ion storage, estimate peak-shaving value by comparing the cost of displaced grid imports with storage losses, operating costs, and the battery’s usable output. Don’t assume every stored unit creates a saving.
To assess system controls and energy coordination, review Smart AI inverter operation alongside the site’s load and export profile.
Lifecycle Costs, LCOE, and Performance Risk
Calculate Levelized Cost of Energy (LCOE) across the chosen analysis period, such as 25 years: divide discounted lifetime costs by discounted lifetime energy production. Include CAPEX, OPEX, scheduled replacements, and generation adjusted for degradation. This reveals whether a lower initial quote also produces lower-cost energy over time.
Compare warranty documents carefully. A 12-year product warranty and a 25-year performance warranty cover different risks. Neither should be treated as a substitute for the other, and the actual terms must be verified for the equipment being quoted. In a 20-year cash-flow model, include an inverter replacement scenario rather than assuming the original unit operates for the full period. Planned maintenance and monitoring can help identify performance gaps. Review the scope of solar system maintenance when estimating those costs.
A commercial solar roi calculator pakistan is more defensible when assumptions are visible and sensitivity-tested. Nippon Energy’s solar project and equipment information can help inform the next stage of project evaluation.
HJT vs. TOPCon: Which Architecture Wins the ROI Race?
Panel selection affects lifetime energy yield, roof-space utilization, and the cost of each kilowatt-hour delivered. The right comparison goes beyond module efficiency. It considers the output each technology can sustain at the project site and the value of energy consumed on-site. Pakistan’s broader renewable energy policy context helps frame the market, but project economics still depend on site-specific performance and tariff assumptions.
Nippon Energy offers HJT and TOPCon solar panels. HJT panels are positioned for industrial ROI through a superior temperature coefficient for Pakistan’s climate and lower degradation, while TOPCon can offer a more cost-effective module choice. Neither architecture wins every project. Use manufacturer datasheets and comparable system designs to test each option under the same operating conditions and financial assumptions.
Nippon HJT Solar Panels: The High-Temperature Advantage
In hot conditions, module temperature can reduce power output. A more favourable temperature coefficient means output declines less as panel temperature rises, which can protect generation during heat exposure. For facilities with limited roof area or high daytime consumption, that retained yield may have added value. Build the comparison using the temperature coefficients in the quoted module datasheets and local operating conditions. Don’t assume an unsupported degradation rate or revenue premium. Calculate both from verified performance data.
For a 25-year model, apply each option’s documented degradation curve year by year, then value generation according to the share used on-site and the applicable export credit. Bifacial modules may add rear-side generation on suitable rooftops or carports, but the gain depends on mounting height, surface reflectivity, shading, and layout. Verify the module’s bifacial rating and model the site rather than assuming a fixed uplift.
Nippon TOPCon Solar Panels: Balancing CAPEX and Yield
TOPCon may suit projects where controlling initial equipment expenditure is a priority and the available roof area can accommodate the design. Explore TOPCon solar panels as one option, then compare documented module performance with HJT on an equivalent basis. For a 1 MW+ project, calculate LCOE using full project CAPEX, OPEX, replacements, generation adjusted for degradation, and the site’s self-consumption and export assumptions.
To compare fairly, hold system size, orientation, inverter design, shading assumptions, and financial horizon constant. Then test how different quoted costs and energy-yield estimates affect payback and LCOE. A commercial solar roi calculator pakistan should show those assumptions separately, so decision-makers can see whether HJT’s heat performance and degradation profile justify its premium for a particular site, or whether TOPCon delivers the stronger project return.
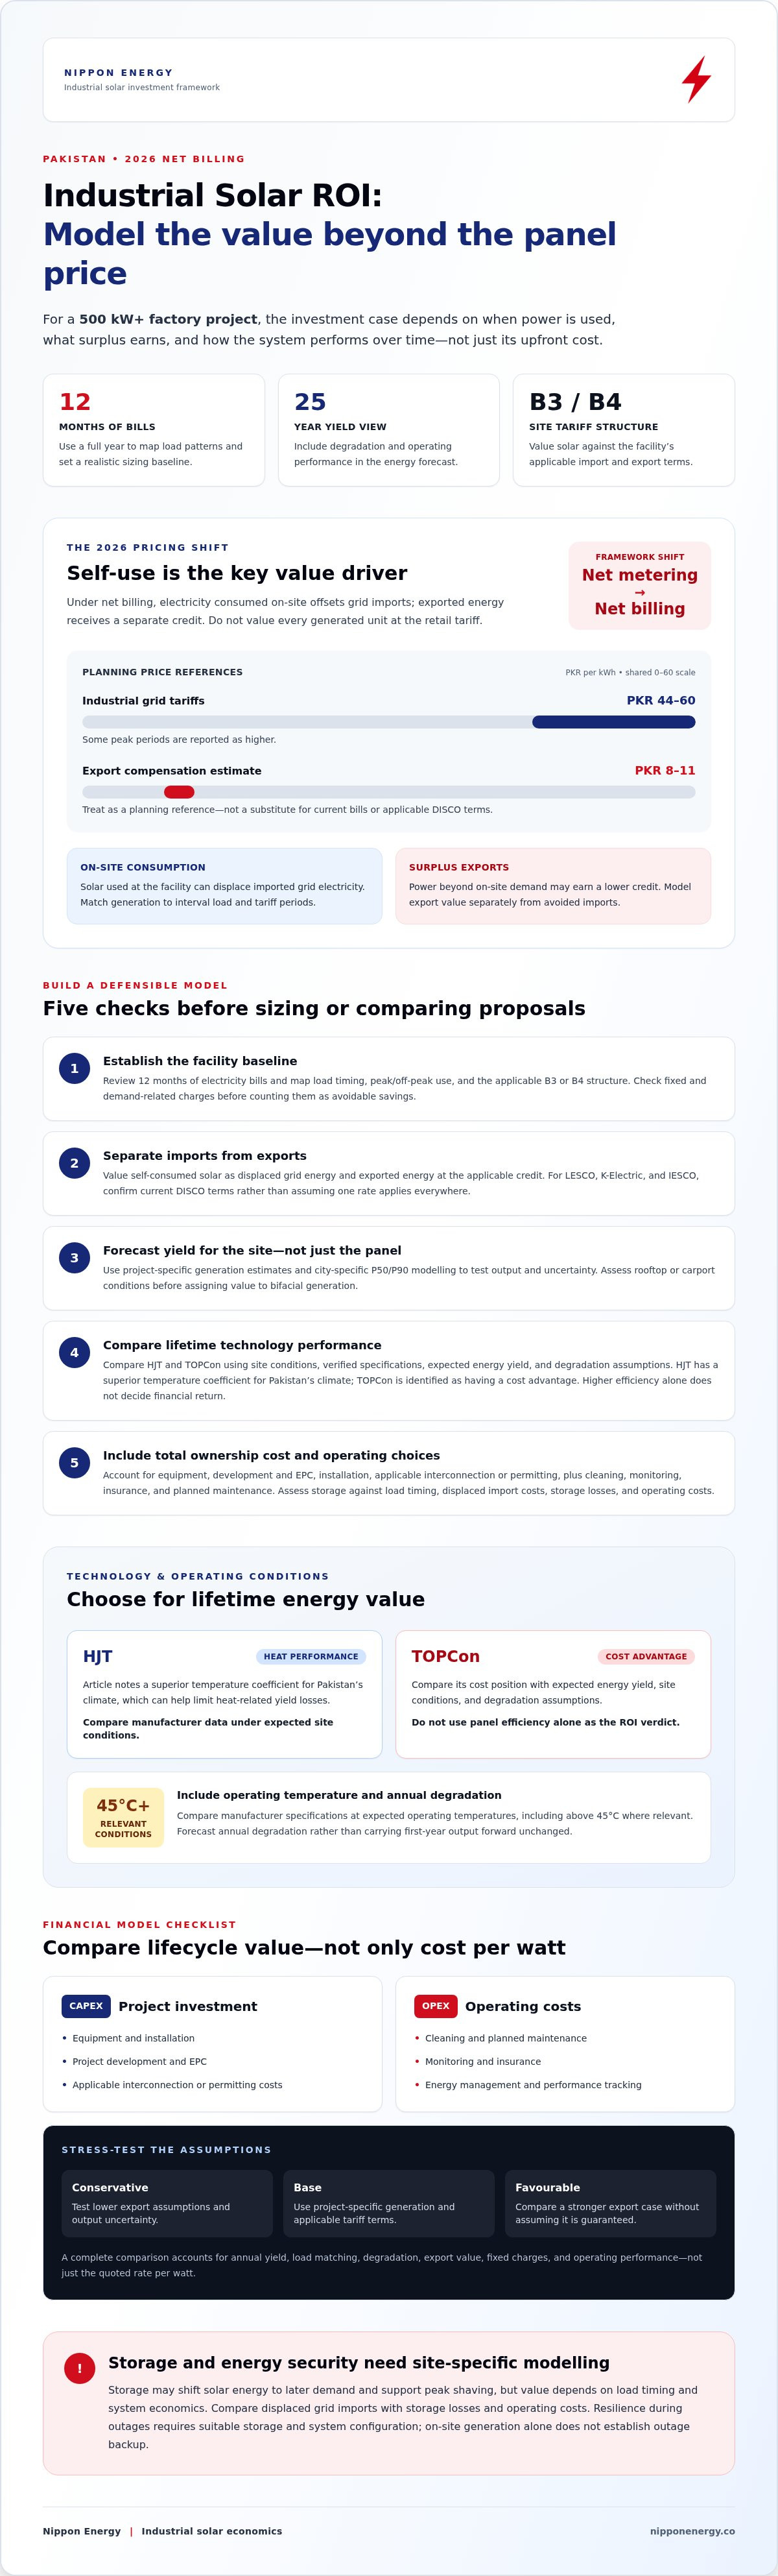
5 Steps to Calculate Industrial Solar ROI in Pakistan
A board-ready model should connect the plant’s load, solar output, billing terms, and financing assumptions. Use these five steps to move beyond a simple cost-divided-by-savings estimate and test how the investment performs under different operating conditions.
- Audit 12 months of electricity bills. Record imported units, tariff periods, demand charges, and seasonal changes. Pair bills with interval or shift-level consumption data where available. This establishes when the facility uses power and which loads solar can realistically serve.
- Estimate site-specific energy yield. Use a city- and design-specific simulation that includes orientation, shading, system losses, and equipment assumptions. Review both P50 and P90 generation cases. P50 represents a central estimate, while P90 provides a more conservative production scenario. Keep assumptions consistent when comparing proposals.
- Model net billing unit by unit. Divide generation into energy consumed on-site and energy exported. Value self-consumed units against the relevant avoided import cost, and apply the confirmed export credit only to surplus. Test the applicable DISCO terms rather than assuming a universal export-to-import ratio.
- Check tax and financing treatment. Don’t enter accelerated depreciation or other tax benefits as guaranteed savings without confirming current eligibility and treatment with a qualified tax adviser. Compare any applicable incentives with a no-incentive case. Evaluate available SBP renewable-energy refinancing and commercial bank financing against the project’s eligibility, markup, fees, repayment schedule, and cash-flow impact. Verify current terms directly with the relevant institution.
- Calculate payback, IRR, and NPV. Build annual cash flows using net energy savings, export revenue, OPEX, replacement costs, financing, and any verified tax effects. Simple payback shows how long it takes to recover the initial investment. IRR and NPV account for the timing and value of cash flows. Run sensitivity cases for generation, tariffs, export credits, and operating costs.
Match Generation to the Factory Load
Compare the solar production curve with shift timings and major daytime loads. A 70% self-consumption ratio can be tested as a planning scenario, not treated as a universal “sweet spot.” The strongest target depends on load shape, export terms, and system costs. For evening demand, assess whether Nippon Lithium-ion Battery Storage Systems can shift solar energy to periods when grid imports are more expensive, accounting for storage losses and costs.
A commercial solar roi calculator pakistan is only as defensible as its inputs. Use documented tariff schedules, model assumptions, and finance and tax terms so decision-makers can review the basis for each result. To assess equipment and project delivery options, explore Nippon Energy’s commercial solar solutions.
Nippon Energy: Engineering ROI through Precision EPC
Solar equipment establishes potential output. Project design, installation, commissioning, and ongoing performance management determine how much of that potential becomes dependable energy value. Nippon Energy provides solar project development and EPC, along with system maintenance and monitoring. Its EPC services bring project development and execution into the scope for evaluation, helping businesses assess design assumptions, expected generation, and operational responsibilities together.
Monitoring data can support better financial control. Soiling, shading, equipment faults, or unexpected output changes can reduce generation and affect savings. Monitoring can reveal performance deviations for investigation, but it does not eliminate them. Nippon Energy offers Smart AI Inverters and the NipponHev product line. Confirm the specific functions and system compatibility during project design.
Turnkey Delivery and Performance Accountability
For an industrial park, define the project scope before comparing proposals. Ask who is responsible for feasibility inputs, equipment coordination, installation, commissioning, monitoring, and maintenance. Confirm any required approvals or licensing responsibilities with the relevant parties. Structural design should reflect the site’s documented wind and roof conditions. Don’t assume a standard mounting solution or guaranteed performance ratio. Request engineering assumptions and a clear method for measuring actual output against the forecast.
Illustrative 500 kW Karachi Payback Model
A 500 kW installation in Karachi can serve as a modelling example, not a verified Nippon Energy case study. To calculate its payback, combine a project-specific generation estimate with 12 months of facility load data, then separate self-consumed units from exports. Apply the site’s confirmed import tariff and export credit, subtract operating costs, and include any verified replacement or financing assumptions. Without project CAPEX, generation, tariff, and load data, a precise payback figure would be misleading. Use the same inputs to test conservative and central scenarios in a commercial solar roi calculator pakistan.
Plan for changing energy needs, too. If future lithium-ion storage expansion is being considered, confirm that the initial system architecture can accommodate it. Don’t assume modular expansion without technical verification. Nippon Energy’s product and EPC scope can be assessed against those requirements. Discuss your facility’s requirements with Nippon Energy, including its load profile, tariff details, and project assumptions.
Turn Your Solar Model into a Strategic Investment
Industrial solar returns depend on more than installed capacity. A defensible commercial solar roi calculator pakistan accounts for the 2026 net billing structure, the share of generation consumed on-site, operating costs, and performance over the system’s life. Comparing HJT and TOPCon against site-specific yield and degradation assumptions helps decision-makers evaluate long-term value rather than choosing on upfront cost alone.
Execution matters, too. Nippon Energy offers HJT and TOPCon panels, Smart AI Inverters, lithium-ion storage systems, and solar project development and EPC. Its maintenance and monitoring services can also be considered when building a model around a facility’s load profile and operating requirements.
Move from estimates to a project-specific financial case. Explore Nippon Energy’s solar project development and EPC services and assess the assumptions behind your investment decision. With the right data and system architecture, your organization can plan its energy investment with greater clarity.
Frequently Asked Questions
What is the average payback period for commercial solar in Pakistan in 2026?
Payback depends on system design, financing, tariffs, and how much solar power the facility consumes on-site. Current estimates indicate around 3.5 to 4.5 years for hybrid systems with high self-consumption, compared with 10 to 12 years for pure on-grid systems with lower export credits. Treat these as indicative ranges, not guarantees. A project model should use the facility’s load profile, verified costs, and applicable DISCO terms.
How does net billing differ from net metering for industrial consumers?
Net metering generally credited exported energy against imported energy at a closer retail-value offset, while net billing values imports and exports separately. Under the 2026 net billing context, exported electricity is estimated at PKR 8 to PKR 11 per unit, while imported power is billed at the applicable tariff. This makes self-consumption more financially valuable. Confirm the rules and agreement terms that apply to your connection before modelling returns.
Does HJT technology really provide a better ROI than TOPCon?
Not in every project. HJT panels have a better temperature coefficient, which can support generation in Pakistan’s hot conditions, while TOPCon modules are generally more cost-effective. Research benchmarks place HJT efficiency around 22% to 23.5% and TOPCon around 21.5% to 22.5%, but quoted module specifications vary. Compare datasheets, site heat conditions, degradation assumptions, roof area, and project costs to determine which delivers lower lifecycle energy cost.
Can I include lithium-ion battery storage in my ROI calculation?
Yes. Model the battery’s installed cost, usable energy, charging and discharge timing, efficiency losses, operating costs, and any replacement assumptions. Then estimate how much stored solar energy can displace grid imports during higher-cost periods. Storage may improve self-consumption under net billing, but its financial case depends on the facility’s load profile and applicable tariffs. Don’t count every discharged unit as a full avoided grid cost without checking the actual billing impact.
What tax benefits are available for commercial solar projects in Pakistan?
Potential tax treatment depends on current rules, project structure, and the business’s circumstances. Don’t assume accelerated depreciation or a specific tax allowance applies without confirmation from a qualified tax adviser. For import-related planning, reported 2026 estimates state that imported solar panels are exempt from customs duty and subject to 10% GST. Verify current treatment and applicability before using it in a financial model.
How does the temperature coefficient affect ROI in cities like Multan or Karachi?
A module’s temperature coefficient indicates how its power output changes as cell temperature rises above the stated reference condition. A more favourable coefficient can reduce heat-related yield loss, which may matter at hot sites such as Multan or Karachi. Use each quoted panel’s manufacturer datasheet and model expected operating temperatures for the specific installation. Don’t apply one citywide yield assumption. Roof design, airflow, shading, and system configuration also affect output.
Is it better to finance commercial solar or use equity?
There’s no universal answer. Compare borrowing costs and repayment schedules with the return your business expects from retaining and deploying its capital elsewhere. Reported estimates put commercial bank solar financing rates commonly linked to KIBOR at around 13% to 15% per year, while SBP renewable-energy refinancing may be available for eligible projects. Verify current scheme terms, fees, eligibility, and tax treatment before comparing financed and equity-funded cases.
What is the typical O&M cost for a 1MW solar plant in Pakistan?
There isn’t enough verified information to give a dependable national cost for operating and maintaining a 1 MW plant. Actual O&M budgets depend on site conditions, cleaning needs, monitoring scope, equipment, access, and the maintenance agreement. Request a project-specific breakdown that separates scheduled maintenance, corrective work, monitoring, and any exclusions. Include expected annual costs and replacement assumptions in the cash-flow model rather than treating O&M as a fixed percentage without supporting evidence.


